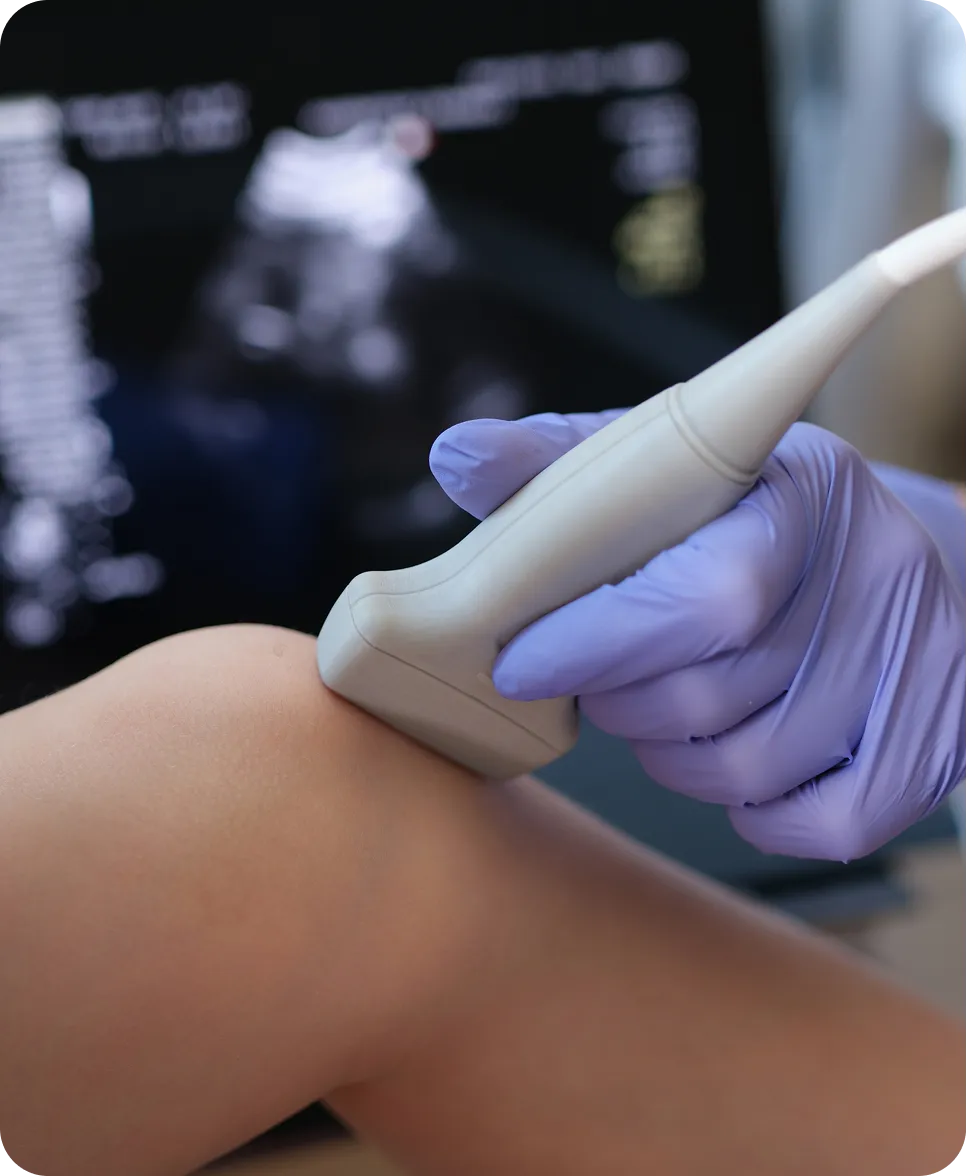
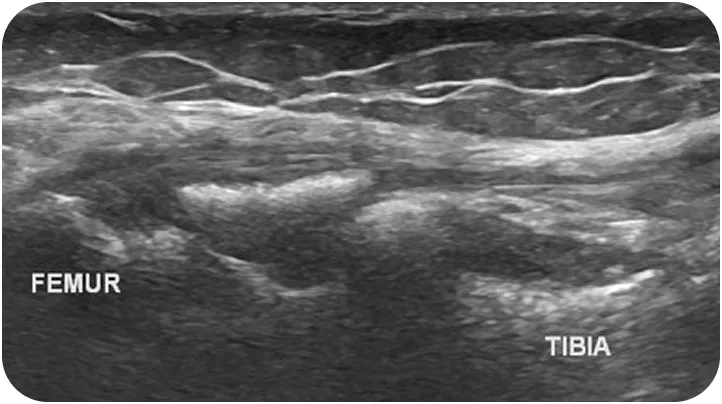
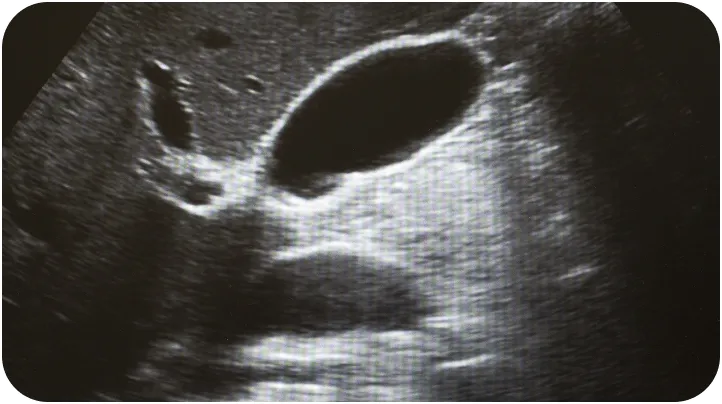
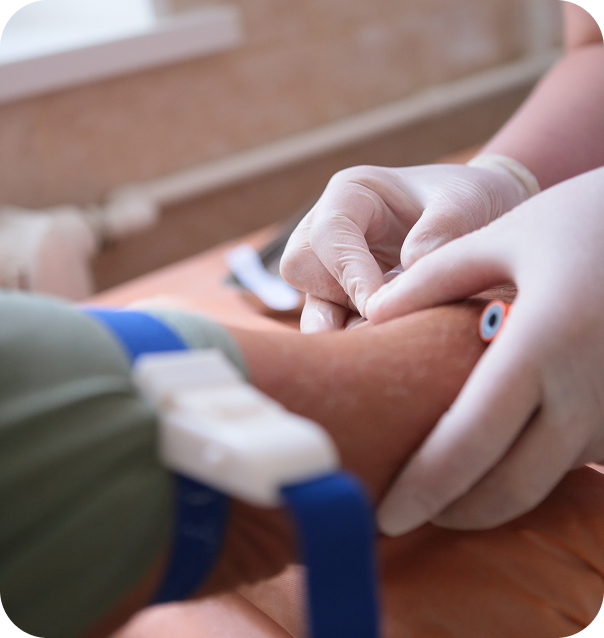
Available diagnostic tests
Add even more precision with our optional advanced labs for more focused insights into your health.
Oncosure Cancer Testing
Epigenetic Panel

Biological Age Test

Food / Mold / Preservative Sensitivity

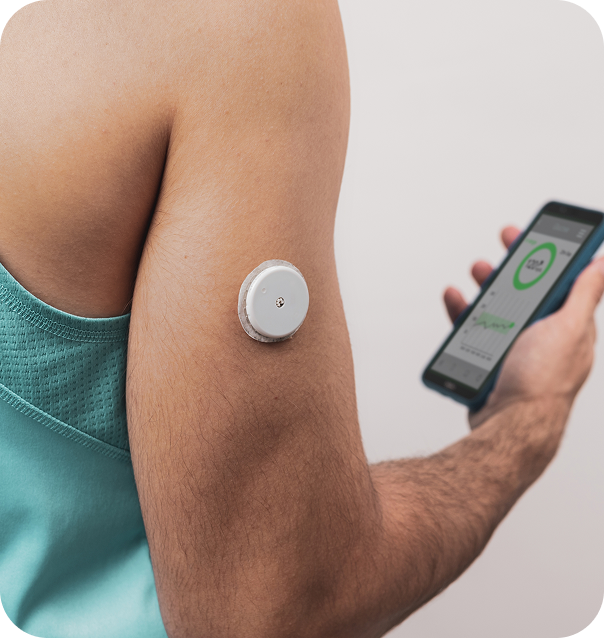
Revolve offers several different forms of diagnostic testing to find out the core of all health concerns and formulate a wellness plan that you can stick to.

Apo B is a core protein found on harmful cholesterol particles that can slip into your artery walls. Checking this number gives you a clear picture of how many risky particles are circulating. Lowering Apo B helps reduce plaque buildup and supports stronger long-term heart health.
LDL Particle Number measures how many cholesterol particles are actually moving through your bloodstream. Even with normal LDL cholesterol, too many particles can still trigger plaque growth. Keeping this number lower offers better protection for your arteries and your heart.
LDL Small refers to tiny cholesterol particles that enter artery walls more easily and spark inflammation. Watching these levels helps you understand your true risk beyond basic cholesterol readings. Reducing them can help you prevent plaque and support healthier blood vessels.
LDL Medium are cholesterol particles that can sneak into your artery walls and raise the risk of plaque buildup. Tracking them gives a more precise look at your heart health than standard cholesterol numbers alone. By keeping these levels in check, you lower your chances of heart disease and improve your odds of living longer, healthier years.
HDL Large particles are the most protective form of good cholesterol and help clear harmful fats from your arteries. Higher levels support better heart health and stronger defense against plaque. Tracking them shows how well your body is managing cholesterol cleanup.
LDL Pattern describes the type of LDL particles you have, ranging from mostly small and risky to mostly large and less harmful. Understanding your pattern reveals hidden cardiovascular risk that routine tests often miss. Improving this pattern can make a meaningful impact on long-term heart protection.
LDL Peak Size indicates how large your LDL particles are. Bigger particles are generally safer, while smaller ones slip into artery walls more easily. Knowing your peak size helps you understand your true risk and guides you toward habits that support cleaner, healthier arteries.
Triglycerides are fats your body stores for energy, but too much of them can thicken your blood and boost your risk of heart disease. Watching this level gives a clear look at how well your body handles sugars and fats. Lowering triglycerides supports better metabolic and cardiovascular health.
Total Cholesterol combines all forms of cholesterol in your bloodstream. While it provides a broad snapshot, it does not always tell the full story. It serves as a starting point for understanding your heart health and whether deeper testing is needed.
LDL Cholesterol is the type often called bad cholesterol because it contributes to plaque buildup in your arteries. Keeping it controlled lowers your risk of heart attack and stroke. Understanding this number helps guide better lifestyle and treatment decisions.
HDL Cholesterol is known as good cholesterol because it helps carry harmful fats away from your arteries. Higher HDL supports better cardiovascular protection. Tracking it helps you understand how well your body is clearing cholesterol.
Non-HDL Cholesterol totals all the harmful cholesterol types that can damage your artery walls. It offers a clearer picture of true risk than LDL alone. Lowering this number can significantly improve your long-term heart health.
The Cholesterol to HDL Ratio shows the balance between harmful and protective cholesterol. A lower ratio means stronger heart protection and healthier arteries. Watching this number helps you gauge your overall cardiovascular risk.
hsCRP measures inflammation in your body, especially the kind affecting your arteries. Higher levels can signal active plaque and a greater risk of heart disease. Reducing this marker supports healthier vessels and a lower chance of cardiac problems.

Microalbumin measures tiny amounts of protein leaking into your urine, which can be an early sign that your kidneys are under stress. Tracking this level helps catch problems long before symptoms appear. Keeping it low supports stronger kidney function and long-term health.
BUN shows how well your body is clearing waste through the kidneys. Higher levels can signal dehydration or reduced kidney function. Watching this number helps you understand how efficiently your body is filtering your blood.
Creatinine is a waste product that your kidneys remove from your bloodstream. If the level is high, it can suggest that your kidneys are working harder than they should. Monitoring it gives you a clear look at kidney performance over time.
The BUN to Creatinine Ratio compares two key waste markers to show whether your kidneys are functioning normally. An imbalance can point to dehydration, overworked kidneys, or other underlying issues. Keeping the ratio steady supports better overall kidney health.
Globulin includes proteins that support immune function, nutrient transport, and overall repair in your body. Changes in this level can signal inflammation or immune issues. Tracking it helps you understand how well your body is balancing these essential proteins.
The Albumin to Globulin Ratio compares two major protein groups in your blood. A balanced ratio reflects healthy liver function, strong immunity, and proper protein production. Shifts in this number can reveal hidden inflammation or nutritional concerns.
Chloride is an electrolyte that helps regulate fluid balance, acidity, and nerve function. When levels move too far in either direction, it can affect hydration and overall metabolism. Keeping it in range supports stable energy and organ function.
Calcium supports strong bones, steady heart rhythm, and proper muscle contraction. Too much or too little can disrupt nerve signaling and bone health. Monitoring this level helps ensure your body has what it needs for long-term strength and stability.
Potassium is an essential mineral that helps control your heartbeat, muscle function, and nerve signals. Even small shifts can affect heart rhythm and energy levels. Keeping this number steady is key for cardiovascular and muscular health.
Sodium helps manage fluid balance, nerve activity, and muscle contractions. When levels are off, it can impact hydration, blood pressure, and overall energy. Monitoring sodium supports better stability throughout your body.
eGFR is one of the most important measures of kidney function and shows how effectively your kidneys are filtering your blood. Higher numbers reflect stronger kidney performance. Watching eGFR over time helps you catch early changes and protect long-term kidney health.

RBC Count shows how many red blood cells you have, which carry oxygen throughout your body. Too low or too high can affect your energy, endurance, and overall health. Tracking this number helps you understand how well your body is delivering oxygen.
Hemoglobin is the protein in red blood cells that binds oxygen and carries it to your tissues. Low levels can lead to fatigue and reduced strength. Monitoring hemoglobin helps you see how effectively your body is fueling your cells.
Hematocrit measures how much of your blood is made up of red blood cells. When it is too low or too high, it can impact oxygen delivery and blood thickness. Keeping it in range supports steady circulation and healthy energy levels.
MCV shows the average size of your red blood cells. Larger or smaller cells can signal nutrient deficiencies or underlying blood conditions. Understanding this number helps you identify what your body may need for healthy red cell production.
MCHC measures how concentrated hemoglobin is inside your red blood cells. If it is low or high, it can reveal issues with cell structure or oxygen-carrying ability. Tracking MCHC gives more detail about the quality of your red blood cells.
MCH shows the average amount of hemoglobin in each red blood cell. Changes in this number can point to iron or vitamin deficiencies. Monitoring it helps you understand how well your red blood cells are equipped to carry oxygen.
Platelet Count measures the number of platelets in your blood, which help with clotting and healing. Too few can raise bleeding risk and too many can increase clotting risk. Keeping this level balanced supports healthy repair and circulation.
RDW shows how much your red blood cells vary in size. A higher number can point to nutrient deficiencies or other blood-related issues. Tracking RDW helps you catch early changes in red cell health.
MPV measures the average size of your platelets. Larger platelets can be more active and may reflect inflammation or increased clotting activity. Watching this number helps you understand how your body is managing repair and clotting.

Total Protein measures the combined amount of albumin and globulin in your blood. These proteins support immune function, healing, and nutrient transport. Tracking this number helps you understand how well your body is maintaining overall balance and repair.
Albumin is a key protein that helps maintain fluid balance and carries hormones, vitamins, and medications through your bloodstream. Low levels can signal liver issues, inflammation, or poor nutrition. Keeping albumin healthy supports stable energy and proper circulation.
Albumin is a key protein that helps maintain fluid balance and carries hormones, vitamins, and medications through your bloodstream. Low levels can signal liver issues, inflammation, or poor nutrition. Keeping albumin healthy supports stable energy and proper circulation.
Total Bilirubin reflects how well your liver is breaking down old red blood cells. Higher levels can point to liver stress, bile duct problems, or increased red cell turnover. Monitoring this marker helps you protect long-term liver function.
AST is an enzyme found in your liver, heart, and muscles. When levels rise, it can signal liver irritation or tissue strain. Tracking AST helps you catch early changes in liver health and overall metabolic stress.
ALP is an enzyme linked to liver function and bone health. Elevated levels can point to bile flow issues or increased bone activity. Watching this number helps you understand how well your liver and bones are working.

Testosterone plays an important role in mood, energy, muscle strength, and sexual health for women. When levels shift too high or too low, it can affect everything from skin clarity to menstrual regularity. Tracking this hormone helps you understand how well your body is maintaining hormonal balance.
Total Testosterone measures all the testosterone circulating in your bloodstream. It gives a broad view of how much of this hormone your body is producing. Understanding this number helps identify symptoms like fatigue, acne, or changes in libido that may be tied to hormonal imbalance.
Free Progesterone reflects the active form of progesterone available for your body to use. This hormone supports a regular menstrual cycle, reduces PMS symptoms, and helps balance the effects of estrogen. Monitoring it gives you insight into cycle health, fertility, and overall hormonal well-being.
Estradiol is the strongest form of estrogen and plays a major role in menstrual cycles, bone strength, skin health, and mood. Shifts in E2 can influence symptoms like irregular periods, hot flashes, or changes in energy. Tracking this hormone helps you understand key stages of female health and how your body is responding over time.
DHEA-Sulfate is a hormone that helps your body produce estrogen and testosterone. It supports mood, energy, skin health, and overall hormonal balance. Tracking this level helps you understand how well your adrenal glands are working and whether shifts in DHEA may be influencing your cycle or stress response.
FSH helps your ovaries develop eggs and plays a key role in regulating your menstrual cycle. Higher or lower levels can signal changes in fertility, ovarian reserve, or the approach of menopause. Monitoring FSH gives you insight into how well your reproductive system is functioning.
LH triggers ovulation and helps regulate the timing of your cycle. Changes in this hormone can affect fertility, cycle length, and hormone balance. Understanding your LH level helps you see how consistently your body is moving through each phase of the menstrual cycle.
SHBG is a protein that binds to hormones like estrogen and testosterone, controlling how much of them is active in your body. When SHBG shifts, it can change how strongly these hormones influence your mood, skin, and cycle regularity. Tracking this number helps you understand how effectively your body is managing hormonal balance.

PSA is a protein made by the prostate gland. Higher levels can signal inflammation, enlargement, or more serious prostate conditions. Tracking PSA over time helps you understand your prostate health and catch changes early.
Total Testosterone measures the full amount of testosterone circulating in your bloodstream. This hormone supports muscle strength, mood, libido, and overall vitality. Monitoring it helps you understand shifts in energy, performance, and long-term hormonal health.
Free Estradiol reflects the active form of estrogen in men. While needed in small amounts, too much or too little can affect mood, body composition, and sexual health. Tracking E2 helps you see how well your body is balancing testosterone and estrogen.
DHEA-Sulfate is a hormone produced by the adrenal glands that helps your body make testosterone and other key hormones. It supports energy, mood, and overall hormonal balance. Monitoring this marker shows how well your adrenal system is functioning.
FSH helps regulate sperm production and overall testicular function. When levels shift, it can affect fertility and hormonal balance. Tracking FSH gives insight into reproductive health and how well your testes are working.
LH signals the testes to produce testosterone. Low or high levels can explain changes in testosterone output and symptoms like low energy or reduced libido. Monitoring LH helps reveal how effectively your body is regulating hormone production.
SHBG is a protein that binds to testosterone and controls how much of it is active in your body. When SHBG is too high or too low, it can influence muscle mass, libido, and energy levels. Tracking this number helps you understand how well your body is managing hormone availability.

hsCRP measures low levels of inflammation in your body, especially the kind that affects your blood vessels. Higher levels can point to increased cardiovascular risk or ongoing inflammation. Tracking hsCRP helps you understand how well your body is managing stress, recovery, and long-term health.
WBC Count shows how many immune cells are circulating in your blood. When this number rises or falls, it can signal infection, inflammation, or changes in immune strength. Monitoring WBC helps you understand how your body is responding to stress and illness.
Neutrophils are the first responders of your immune system and help your body fight bacterial infections. Higher or lower levels can reveal how actively your immune system is working. Tracking them gives insight into your body’s frontline defense.
Lymphocytes help your body fight viruses and support long-term immune protection. Changes in this level can reflect stress, infection, or immune imbalance. Monitoring lymphocytes helps you understand how well your immune system is adapting.
Monocytes help clean up damaged cells and support healing throughout your body. When levels shift, it can signal inflammation or immune system activation. Tracking this number shows how your body is managing recovery and repair.
Eosinophils play a role in allergic responses and help defend against parasites. Elevated levels can point to allergies, asthma, or certain infections. Monitoring eosinophils helps you understand how your body responds to environmental triggers.
Basophils support your immune system by releasing chemicals that help manage allergic reactions and inflammation. Higher levels can reflect allergic activity or immune system shifts. Tracking them offers insight into subtle changes in your inflammatory response.

UIBC measures how much iron-binding capacity remains available in your blood. Higher levels usually mean your body has room to carry more iron, while lower levels may suggest iron overload. Tracking UIBC helps you understand how efficiently your body is managing iron balance.
Ferritin shows how much iron your body has stored for future use. Low levels often signal iron deficiency, while high levels can reflect inflammation or excess iron. Monitoring ferritin helps you understand your long-term iron status and energy support.
Transferrin is a protein that transports iron through your bloodstream. When levels shift, it can signal changes in iron needs, liver function, or overall nutritional status. Tracking transferrin helps you understand how well your body is moving iron to where it is needed.
Total Iron Binding Capacity (TIBC) reflects how much iron your blood can carry. Higher numbers often indicate low iron stores, while lower numbers may point to inflammation or excess iron. Monitoring TIBC helps you see the bigger picture of iron availability.
Serum Iron measures the amount of circulating iron in your blood. This number can shift throughout the day, so it is best interpreted with other iron markers. Tracking it helps you understand how much iron is immediately available for energy and red blood cell production.
Transferrin Saturation shows what percentage of your iron transport protein is actually carrying iron. Low levels often point to iron deficiency, while high levels may signal excess iron. Tracking this value helps you understand how much iron your body can use right now.
Iron Percent Saturation measures how fully your iron-binding proteins are loaded with iron. It gives a clear snapshot of whether you have too little, too much, or just enough iron for healthy function. Monitoring this number helps you maintain a balanced iron status.

Free T3 measures the active form of triiodothyronine that is available for your cells to use. This hormone drives energy production, metabolism, and body temperature. Tracking Free T3 helps you understand how well your thyroid hormones are actually working in your body.
Total T3 includes both the active and protein-bound forms of triiodothyronine in your blood. It offers a fuller picture of your thyroid output. Monitoring this level helps identify changes in metabolism, energy, and overall thyroid function.
Free T4 shows the amount of thyroxine circulating in your blood that is not bound to proteins and can be converted into active T3. It is one of the most important markers for thyroid health. Tracking Free T4 helps you see how well your thyroid is producing the hormones your body needs.
Total T4 measures both bound and unbound thyroxine. It helps assess overall thyroid hormone production and can reveal issues with metabolism or protein binding. Monitoring Total T4 gives you another layer of understanding about your thyroid system.
TSH is the signal from your brain that tells your thyroid how hard to work. High or low levels often appear before other thyroid hormones shift. Tracking TSH helps you understand whether your thyroid is underactive, overactive, or functioning in a healthy balance.

IGF-1 is a hormone that reflects how well your body is producing growth hormone. It supports muscle repair, energy, metabolism, and healthy aging. When levels are too high or too low, it can influence recovery, strength, and long-term wellness. Tracking IGF-1 helps you understand how effectively your body is maintaining growth and repair.

Glucose measures the sugar in your bloodstream at the moment of the test. Higher levels can point to insulin resistance or early blood sugar imbalance. Tracking glucose helps you understand how well your body is managing energy throughout the day.
HbA1c shows your average blood sugar levels over the past three months. It gives a long-term view of how well your body is controlling glucose. Monitoring this marker helps you catch early changes that can affect energy, metabolism, and overall health.
Insulin is the hormone that helps move sugar from your blood into your cells. When levels rise too high or drop too low, it can signal insulin resistance or other metabolic issues. Tracking insulin helps you understand how efficiently your body is regulating blood sugar and energy.

Vitamin B12 supports energy production, nerve health, and red blood cell formation. Low levels can lead to fatigue, tingling, or trouble concentrating. Tracking B12 helps you understand whether your body has the nutrients it needs for steady energy and mental clarity.
Vitamin D supports bone strength, immune function, mood, and hormone balance. Low levels are common and can affect energy, immunity, and overall wellness. Monitoring vitamin D helps you see whether your body is getting enough sunlight or nutritional support.
Magnesium plays a key role in muscle function, nerve signaling, sleep quality, and stress response. Low levels can lead to muscle tension, poor sleep, or low energy. Tracking magnesium helps you understand how well your body is supporting relaxation, recovery, and overall balance.